

Alternative energy solutions to Oil and Gas have never been more popular than they are today. At present, our country is experimenting, primarily, with solar, wind, and battery alternatives to fossil fuels. In this article, we will review today’s solar energy market.
The history of solar power is both much longer and far more interesting than I anticipated. The US Department of Energy put together a summary PDF outlining the History of Solar. [Eere.Eenergy]
Our first introduction to learning to use the sun’s rays to focus energy began in the 7th Century BC, where we read of people using glass to focus sunlight to start fires and burn ants. Much, much later, in 1767, a Swiss scientist, Horace de Saussure developed the world’s first solar collector.
In 1839, the birth of using solar to convert to electricity began when French Scientist Alexandre Edmond Becquerel. Becquerel discovered that some materials, when exposed to the sun, generated small amounts of electricity. Nearly 40 years later, William Grylls Adams and Richard Evans Day produced the first known photovoltaic cell and used it to convert the sun’s energy to usable electricity. [Semper Solaris]
Advancements in solar continued, and in 1974 the US Congress passed the “Solar Heating and Cooling Demonstration Act of 1974” following the Arab oil embargo of 1973, in order to advance alternative forms of energy in the United States and to lessen our dependence on foreign oil.
A few years later, Home Depot (in 2001), began selling solar power systems in three of its stores in San Diego, California. The following year, they expanded to 61 stores. In 2005, President Bush and Congress crafted the Energy Policy Act of 2005 (EPAct) [Institute for Energy Research] This act gave solar tax credits for those installing solar panels, both corporations and private home owners.
These government programs encouraged the rapid expansion of solar. This, combined with the price reductions due to advancements in photocell storage and manufacturing, led to record solar deployment ramping up in 2008. [SEIA]
Now that we’ve covered the history of solar and the impetus behind the boom of the technology and deployment, let’s discuss the business side of solar.
The modern boom solar installations had much to do with advancements in technology, but it had even more to do with Government subsidies. In 2009, the Government introduced the American Recovery and Reinvestment Act (ARRA). As part of this recovery initiative, the ARRA included $2.3 trillion in infrastructure, $90 billion of which was set aside to develop and stimulate Green Energy Initiatives. [Forbes]–[White House Archives]
The largest recipients of these government grants were solar manufacturers. While it has helped to establish some solar manufacturing in the US, solar cell production is still largely dominated by Asian markets.
Unfortunately, much of the money spent in the ARRA was neither vetted nor well monitored. Solyndra, likely the most well known failure from the ARRA funding received $570 million in funding, yet bankrupted 2 years later.
One year later, Abound Solar received $401 million in ARRA money to expand production of manufacturing capacity in Colorado and Indiana. Similarly, two years later, the company collapsed into bankruptcy.
Solar manufacturing has yet to develop into big business in the United States. Part of the reason was listed in the previous paragraph.
Until now, most U.S. solar projects have sourced panels from Asia, where costs are lower, but international supply risks have worsened since the coronavirus pandemic. Customs delays, uncertainty over tariffs and soaring global demand have hiked import costs and with U.S. deployment set to soar, more developers are seeking domestic products to reduce delivery risks. [Reuters]
It should be stated, the reason Government Funding was necessary to start the production of domestic solar directly correlates to the lack of “need” in the manufacturing sector in solar (similar to many other manufacturing sectors). As with many other manufacturing industries, it is cheaper to import these items from Asia than to produce solar products domestically. While labor is a large portion of the cost offset, tariffs do not favor US production either.
Solar installers, as a group, have likely had as rough a road as anyone in maintaining profitability. These companies tend to grow well, but repeatedly get behind in the cash cycle. Much of this trend has to do with when they receive payments and how they manage cash. Another larger factor is growing competition in the sector, driving down margins in an attempt to maintain or grow market share, leading to decreased profitability.
Solar installers are specialized construction companies. Most of them receive the majority of their revenue through a solar finance company. They are also, usually, structured for milestone payments. Milestone invoicing/payments are a form of payment based on when contracted milestones requirements are met in the sales or installation process.
For solar installers, many use three (3) milestone payments (although this is quickly changing in today’s market, due to pressures from solar finance companies). Milestone1 (M1) is often triggered upon contract execution (The closing of the sale). Historically, M1 has been a pretty significant payment with established solar installers, ranging from 25% to 70%. In full disclosure, the higher payment rates (above 40%) do not tend to last long and are more of a marketing tool used by solar finance companies to attract sales organizations to promote their product.
Milestone 2 (M2) is typically triggered on installation completion. These industry timelines do vary a bit, but average four to six weeks post sale, and residential installs take about one day to complete. At M2, the solar installer is paid the remainder of the contract balance, minus the Milestone 3 (M3) payment, usually 10%.
Milestone 3 payments are released on permission to operate (PTO) from the utility provider. M3 is the one milestone solar installers have little to no control over. Although M3 is a smaller pay out, it can have a considerable impact on cash flow.
Nearly every solar installer has a time trigger built into their funding contract. That timer usually starts at M1 and averages 90 to 150 days. Once the M1 payment is released, the solar install has (we will call it 120 days in this example) 120 days to complete the install and for that project to enter PTO.
If the installation job does not reach PTO in the allotted time, the solar finance company “claws-back” the money paid at M1 and M2 on the job. This leaves the solar installer in a short position, as typically they have paid out 100% of the job expense at that time and now have $0 in revenue.
Now that we see how cash flows through a solar installer, let us begin to explore where things can begin to stack up and cause unhealthy and often lethal issues for the solar install company.
If installs take 6 weeks, a solar installer has a very nice cash cushion in the beginning of the organization (and as long as sales maintain an aggressive growth rate). If sales begin to slow, the M1 payments begin funding current installs that were sold 6 weeks ago and cash begins to decline, as depicted below.

*Assumed: Job Flow is perfect, 10% cancels (which is very low, typically closer to 20%), 10% Net Profit [Step By Step Business] (Average for Solar Installers (75% Gross Profit and 15% SGA = 10% Net Profit), and no claw-backs were assumed.
As the Sales slow, in a cash advance situation (collecting money on Milestone 1, before any work has been performed) leaves a company very susceptible to a sales slowdown.
***PLEASE NOTE*** This model shows a perfect business! In this model:
All cash stays within the company
Cancellation are jobs that cancel before any construction is started. Therefore, M1 was paid, but no work completed. When the cancelation is reported to the finance company, that money is “clawed-back” from the solar installer’s next payment.
As detailed in this article [Palmetto], from 2000 to 2016, 8,700 solar companies installed solar. By the end of 2016, only 2,900 remained, showing a 67% failure rate. Cash management and capital planning are imperative parts of growing a solar installation company. Failure to follow strong financial disciplines is quickly fatal in this business.
Another complication for solar installers is properly reporting on Financial Statements. Often, in the early stages of the company, professional accountants and finance personnel are not employed. With the rapid growth of these companies, the financial statements can become messy in a hurry.
Frequently, the company begins recording revenue when they receive payment on the M1. As this is an advance payment on work yet to be performed, it should be placed on the balance sheet as a liability (unearned revenue). The misreported revenue makes the company look more profitable than it really is. This mistake also leads to mistimed expense to revenue tracking. Early on, the company will show great income, as it is collecting cash up front, while logging virtually no expense. As installs ramp up and sales cool during slow sales times, the company will look unhealthy as they are paying for installs they showed revenue on weeks or months earlier. This trend will tend to repeat itself annually, with the seasonality of the company’s install schedule.
For business owners and finance partners alike, this makes the financials unreliable and “moody”, as profit and loss will swing erratically. This oscillation results in the financial reports being an unreliable representation of the company’s actual performance. Improper revenue and expense recognition also leads to increased scrutiny for bank lending, as banks do not like “bouncy” profits and losse
While solar finance companies have not had the early issues of bankruptcies, they still face a long, difficult, and largely unprofitable road in the near future. In researching this segment of the solar industry, I limited my focus to public companies, as financial reporting is much more readily available and reliable.
The challenge facing solar finance companies are competition and interest rate changes. As government incentives for solar increased, so did the number of companies willing to offer financing for solar projects.
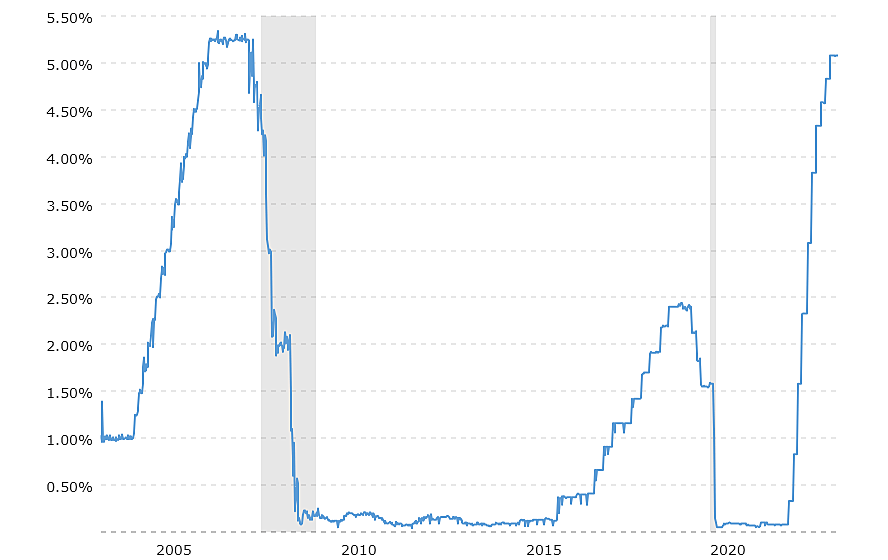
Solar finance companies are lenders, thus their primary and long term profit comes from the interest they earn on financing the solar project. The bank pays interest in the money it borrows to lend. Their interest rate is whatever the Fed Rate is (see chart below), plus additional risk associated costs to them. (In this article, we are simply using the Fed Rate for calculations.) The Fed Rate changes periodically, thus causing risk to the future earnings of finance companies.
Additionally, these companies charge a finance fee that averages 25% of the total cost of the solar install. The average cost of a solar install in California, without batter backup, is about $45,000. Twenty-Five percent of this is $11,250 as a finance fee, taken at the initial financing of the project. A third income source can be offering PPA (Power Purchase Agreement, read about them here). In these agreements, the finance company owns the equipment and receives the 30% tax incentive from the Federal Government.
A breakdown shows how these companies can make money on a typical loan or PPA product:
Loan
PPA
Amount
$45,000
$45,000
Origination Fee (25%)
$11,250
$11,250
Interest (25yr, 2.99%)
$18,948
$18,948
Government Rebate (30%)
$0.00
$13,500
Total
$30,198
$43,698
While these are great returns, the interest is realized over the life of the loan (25 years). That long term return comes with the risk of changing interest rates over that 25 year time. To analyze the difference in the program on changing interest rates, see the chart below.
(The difference in the Fed Rate (Federal Interest Rate) over the past 15 years.)

Loan
PPA
Amount
$45,000
$45,000
Origination Fee (25%)
$11,250
$11,250
Interest (25yr, 2.99%) Charge
$18,948
$18,948
Int Rate Cost (Avg 0.2% 2009-2015, Currently 5.08%)
($1,138)
($34,550)
Total
$29,060
($4,352)
(Please note, banks pay varying amounts more than the Fed Rate, this is being used as a best case scenario)
As you can see, changes in interest rates(Fed Rate) (especially a 25x increase) can be hugely impactful on the profit/loss of a finance company! In the following section, we take a look at how solar finance companies are fairing.
As is shown by their Operating Income/Profit, these groups struggle to turn a profit from their primary operations core.
Reviewed Companies (Data from GuruFocus)
Sunnova (NOVA)

Sunlight Financial Holdings (SUNL)

SunRun (RUN)

SunPower (SPWR)

As can be seen here, the market is tough for solar finance companies. Most are well backed (with funding) and have positive long term outlooks. However, perpetual losses are beginning to weigh on these companies leading to tighter lending metrics, cost cutting measures, and less funds available for solar installs. As a trend, this will likely slow the solar boom, at least temporarily.
In conclusion, all areas of the solar industry are facing heavy challenges in the 2023. The failure of solar manufacturing to take root in the United States means the industry is dependent on international trade, something easily disrupted by government relationships, as was shown when the US banned solar imports from China in 2022. [Reuters]
The collapse of Silicon Valley Bank, quickly followed by the fall of Signature Bank and Silvergate Bank rocked lending markets in the US. These banks were heavily in the solar industry. Bank failures, when timed during rising interest rates create a brutal market for companies to survive in, especially ones like solar lenders, who’s primary income is interest on solar loans.
When you combine a constricted supply chain with a bad lending market, solar install companies literally watch cash reserves dry up around them. Lending is difficult to obtain. Vendors, who have leveraged much of their supply, begin freezing or calling credit lines to cover their cash shortages, forcing more precious cash from the coffers of the install companies. The solar finance companies, who historically struggled to turn a profit in good solar markets, become desperate to conserve cash and tighten their monetary policy with solar installers. This leaves very few financial friends for a solar install company at a time when they need financial friends the most.
Solar in 2023 and likely into 2024 will remain a difficult market to navigate. The coming commercial property implosion, quickly to be followed by the next housing downturn [Forbes] are not likely to offer much reprieve to the ailing solar market.

